Resistive Accelerometer Design Example
- Categories:Software case
- Author:
- Origin:
- Time of issue:2022-07-03
- Views:678
Resistive Accelerometer Design Example
(Summary description)
- Categories:Software case
- Author:
- Origin:
- Time of issue:2022-07-03
- Views:678
The lntelliSuite software can realize the complete design process of various MEMS devices from layout design, process design to device performance design and system design. It can complete the direct extraction of process simulation structure, meshing, multi-physics analysis, and parametric analysis.
Accelerometer Design Example
In this example, the extraction, meshing and multiphysics analysis of the process simulation structure will be demonstrated. That is, through physical-level simulation, IntelliSuite's process simulation module FabSim can provide users with a structure that accurately approximates the real results. Before meta-analysis, IntelliSuite can extract the structure of the process simulation, convert the voxel model into a geometric model, and after necessary simplification, the meshing engine can process this geometric model, build an FEA model, and use it for subsequent multiphysics Analyzing. The following example of an accelerometer is a real device designed with IntelliSuite software tools, and its design process will fully explain the powerful functions of IntelliSuite software.
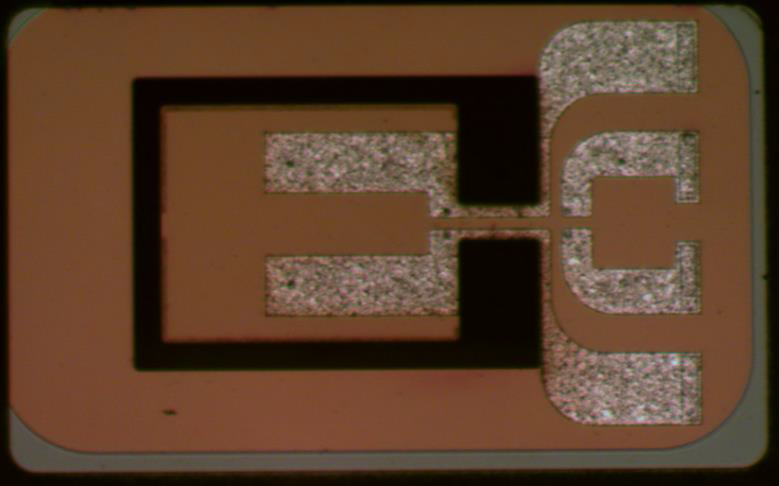
1. Physical-level process simulation

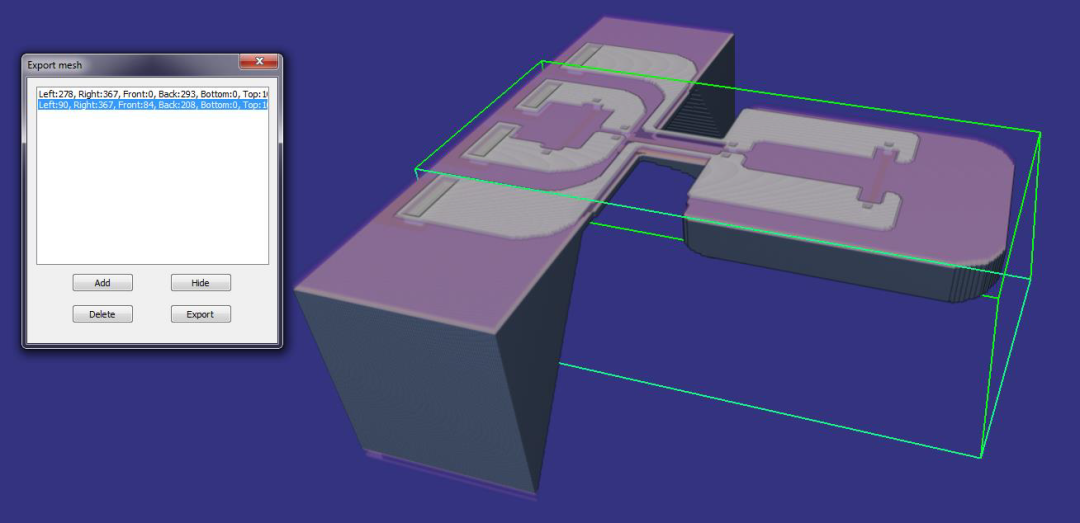
2. Extract core components
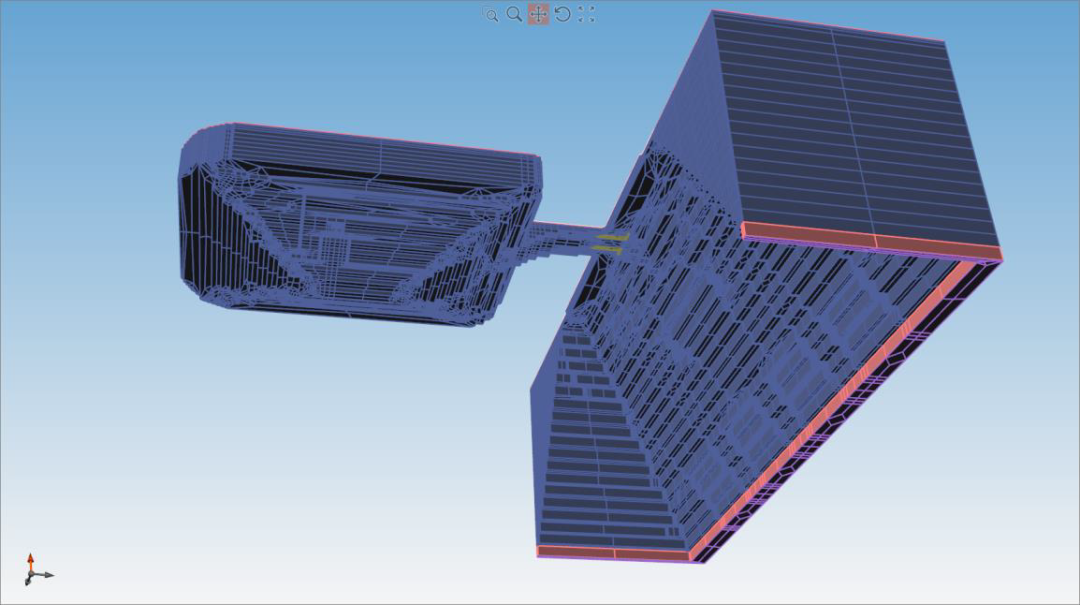
3. Build the geometric model
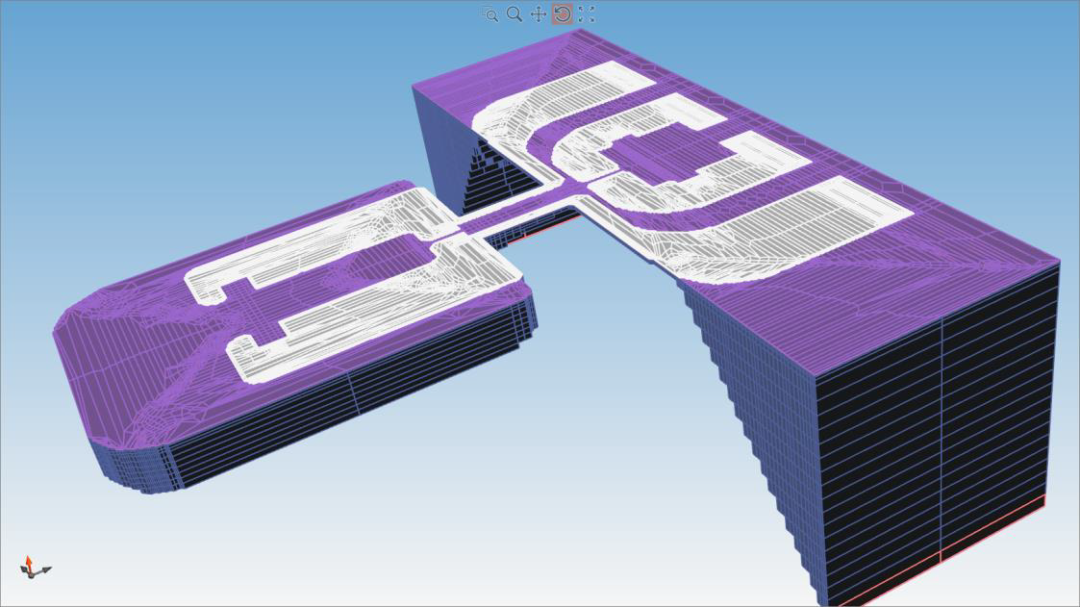
4. Automatic meshing
5. Its working principle is that after a certain acceleration is applied to the mass block, stress is generated inside the device, and the stress affects the size of the piezoresistive resistance value, extract the piezoresistive sub-model, and then apply an appropriate load, as shown in the following figure, The potential distribution and temperature distribution of the piezoresistive sub-model are obtained, and the potential difference that can reflect the acceleration can be obtained by measuring the potentials of PAD1 and PAD3.
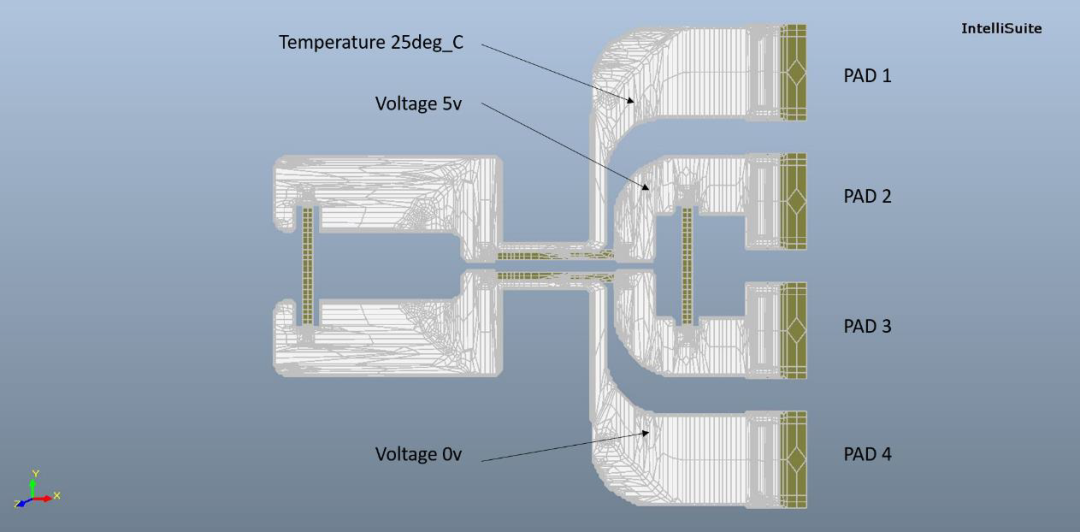
(load diagram)
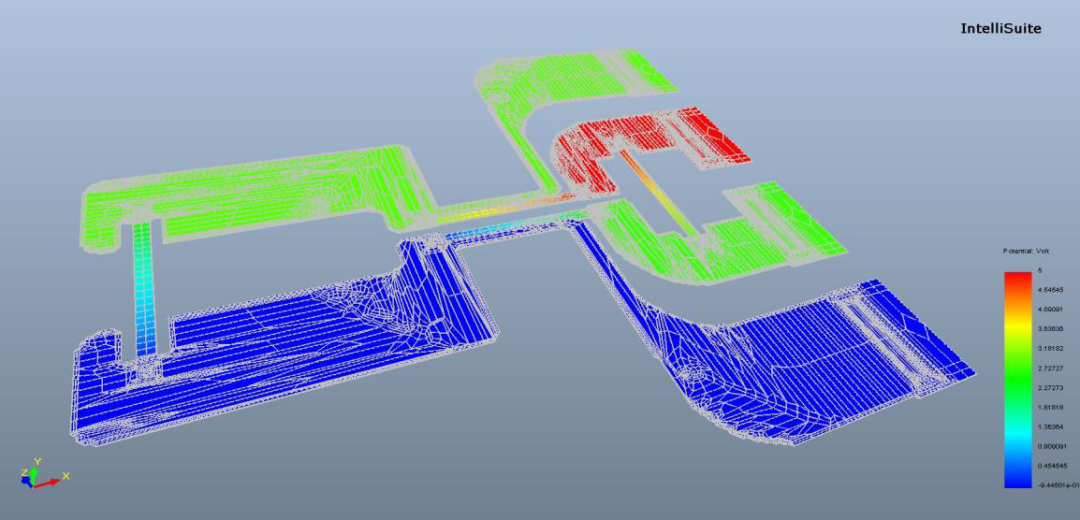
(Electric potential cloud map)
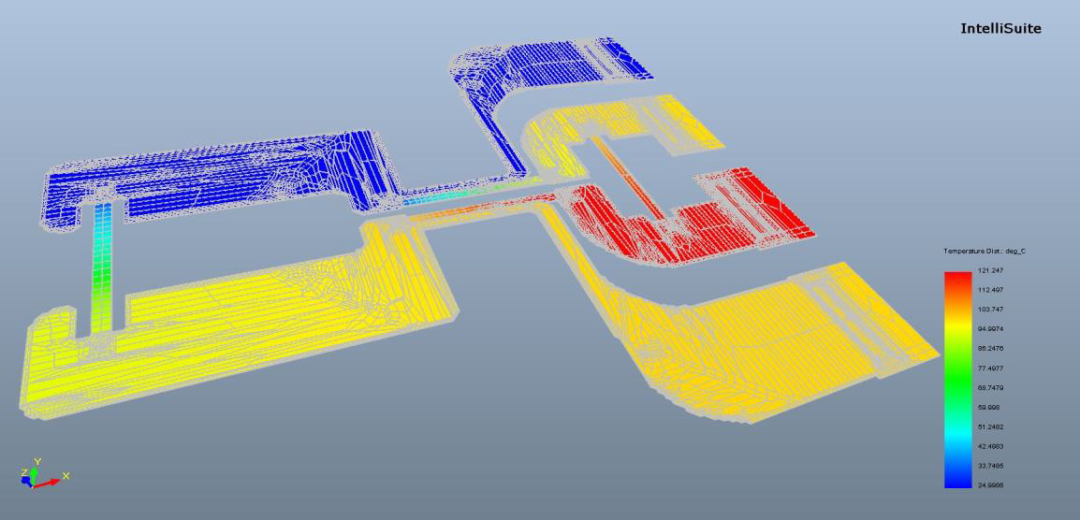
(temperature cloud map)
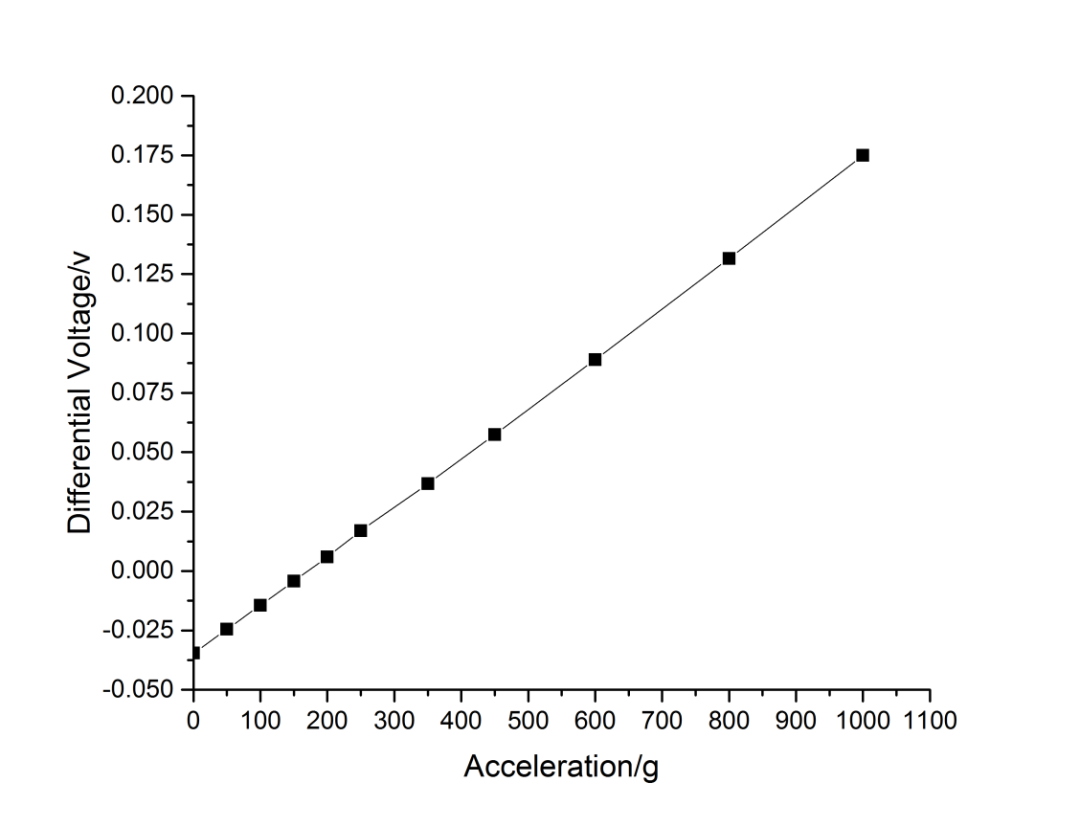
6. After analysis, the performance curve of acceleration can be obtained. It can be seen from the measurement of multiple sets of data that the device has a good linear relationship.

Scan the QR code to read on your phone
Applications
Learn how Intellisense can help you?
E-mail:china@intellisense.com
Add:No. 19, Lixin Road, Nanjing Jiangbei New Area, Nanjing City, Jiangsu Province


Copyright © 2022 Jiangsu Intellisense Technology Co.,Ltd. 苏ICP备08107867号 Powed by:300.cn SEO
 Tel
Tel Messages
 Top
Top